

Fiber Photometry Data Analysis Software
Accelerate your fiber photometry and behavior analysis - WITHOUT CODING!
danse™ is fiber photometry data analysis software for processing, analyzing, and visualizing neural and behavioral data. It provides no-code workflows for ΔF/F calculation, motion-artifact removal, signal filtering, spike detection, peri-event analysis, behavioral synchronization, and group analysis. Researchers can import fiber photometry data from Doric and other systems, align neural activity with behavioral events, build reusable analysis pipelines, and process data from multiple animals.

All-in-one solutions:
Convert to Doric format
Import behavior data
Create Analysis Pipelines
Pool data by conditions
Export figures
danse™ offers a growing set of tools and operations, including fiber photometry, behavioral data, data conversion, and advanced analysis operations. Browse the categories below for an overview of the most popular operations and their tutorial videos. New operations are added reguarly based on user requests.


Fiber photometry analysis workflow

- Import your files - Load fiber photometry data from Doric or compatible systems.
- Process the signal - Filter, smooth, interpolate, remove artifacts, calculate ΔF/F, and standardize signals.
- Synchronize behavior - Import behavioral data, video tracking, TTL events, or timestamps.
- Define behavioral events - Identify events such as stimulus resentation, reward delivery, freezing, zone entries, interactions, or other behaviors.
- Analyze neural activity - Perform peri-event analysis, signal statistics, spatial analysis, and spike/peak detection.
- Analyze across animals - Pool recordings according to experimental groups and conditions.
- Export results - Export figures and processed data for publication or downstream analysis.
Conversion Operations
What fiber photometry data is compatible with danse™ software?
danse™ supports fiber photometry data from Doric Lenses and other acquisition systems. Import and convert data from Tucker-Davis Technologies (TDT), Neurophotometrics, RWD, and custom fiber photometry systems using supported CSV, XLSX, and other file formats.


TDT fiber photometry data analysis
TDT fiber photometry data analysis
Perievent Histograms (also called peri-stimulus time histograms or PSTHs) visualizes changes in neural activity in response to the onset (or offset) of a stimulus or behavior of interst (i.e event). This plot is calculated by aligning and averaging the ΔF/F0 centered arount that. This results in a histogram that shows the average neural response over time.
Statistics associated to the PeriEvents trace are also calculated, including Aera-under-the-curve (AUC), maximum, minimum, etc.
Plot perievent as a heatmap. For single animal perievents, each row corresponds to an event (trial/bout), while for group analysis perievents, each row corresponds to the average trace of one animal.
Neurophotometrics data analysis
Neurophotometrics data analysis
Perievent Histograms (also called peri-stimulus time histograms or PSTHs) visualizes changes in neural activity in response to the onset (or offset) of a stimulus or behavior of interst (i.e event). This plot is calculated by aligning and averaging the ΔF/F0 centered arount that. This results in a histogram that shows the average neural response over time.
Statistics associated to the PeriEvents trace are also calculated, including Aera-under-the-curve (AUC), maximum, minimum, etc.
Plot perievent as a heatmap. For single animal perievents, each row corresponds to an event (trial/bout), while for group analysis perievents, each row corresponds to the average trace of one animal.
RWD fiber photometry data analysis
RWD fiber photometry data analysis

The Signal Statistic operation examines changes in neural activity over the duration of the entire duration of an event/time preiod (i.e not just the onset/offset of the event). This operation is ideal for behaviors of varying lengths (freezing, entering zone, animal interactions, etc.).
Calculate the following statistics:
- z-ΔF/F0 : AUC, mean, median, max, min
- Spikes : amplitude, firing rate, # spikes
Custom fiber photometry data (csv/xslx)
Custom fiber photometry data (csv/xslx)
danse™ allows for easy data export, either as figures (.pdf, .png, .jpeg) or as .csv files.


Create an Experiment Project
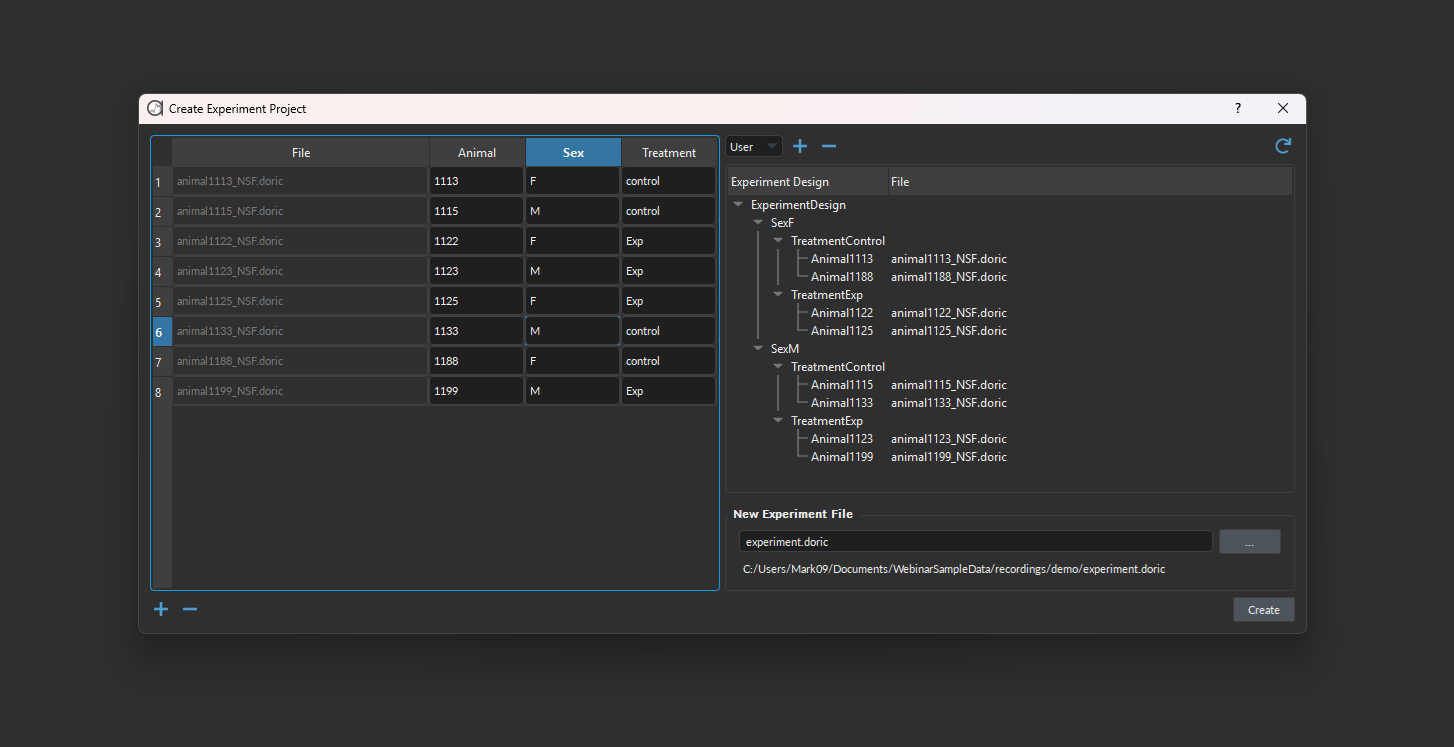
danse™ provide a simple framework to organise all your fiber photometry & behavior data. Save all the metadata related to each recording (Animal ID, sex, genotype, batch, etc.) and the experimental design (group, treatment, trial, task, etc.).
From the Experiment project, you can:
- Build Pipeline - run several operations over all your data files
- Link behavior data - import the right CSV or video data to the right fiber photometry file
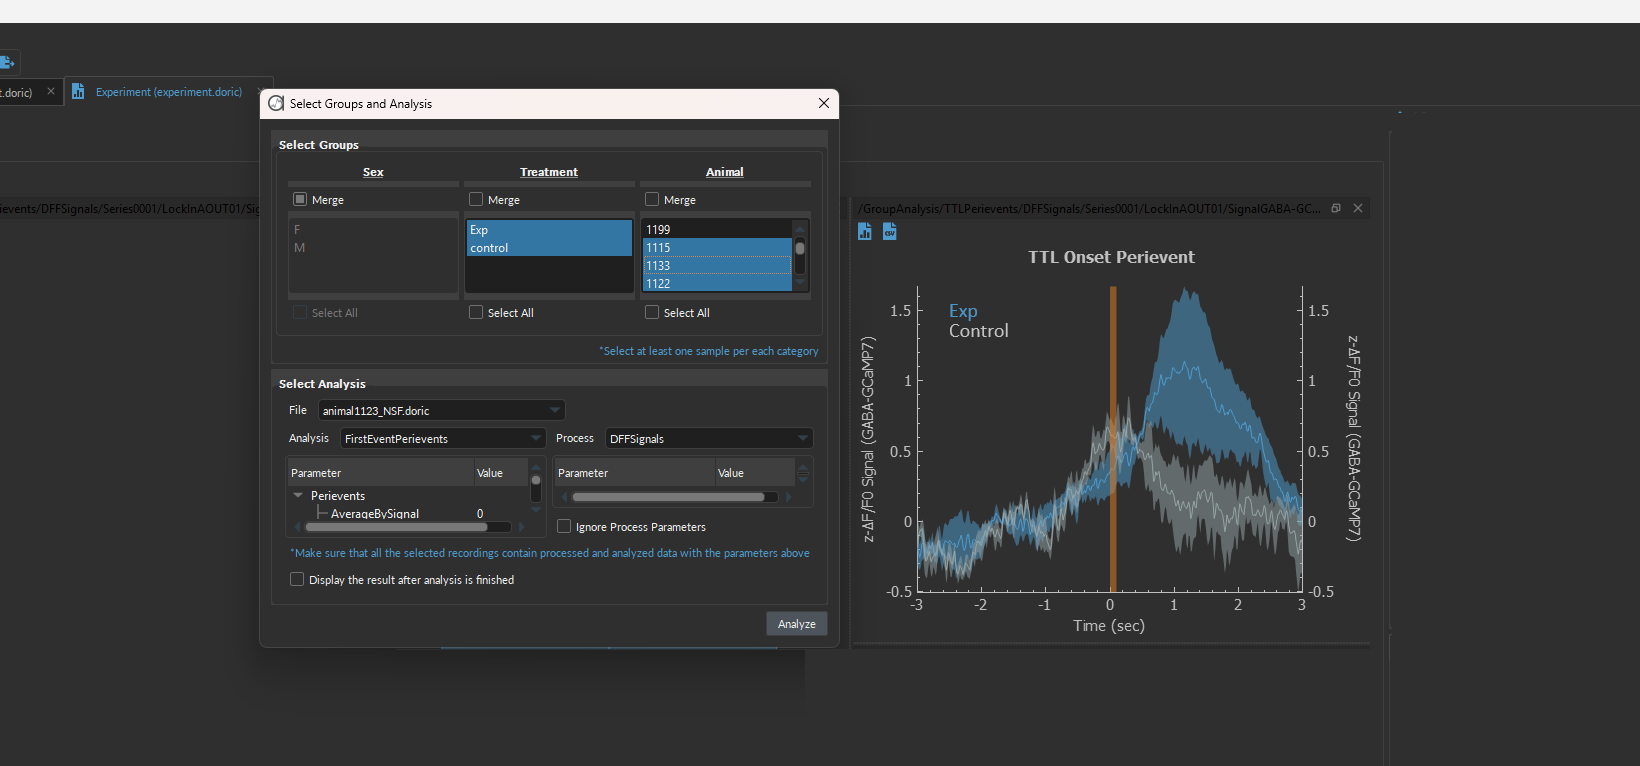
- Group Analysis - pool data together according to your experimental design

Split file Operation
danse™ assumes each data file within the project is associated to a signle animal. However, often time, the data of multiple animals is recorded simultaneously in the same data file. Thus, before creating the experiment project, it is important to split the file accordingly.

Create Pipeline
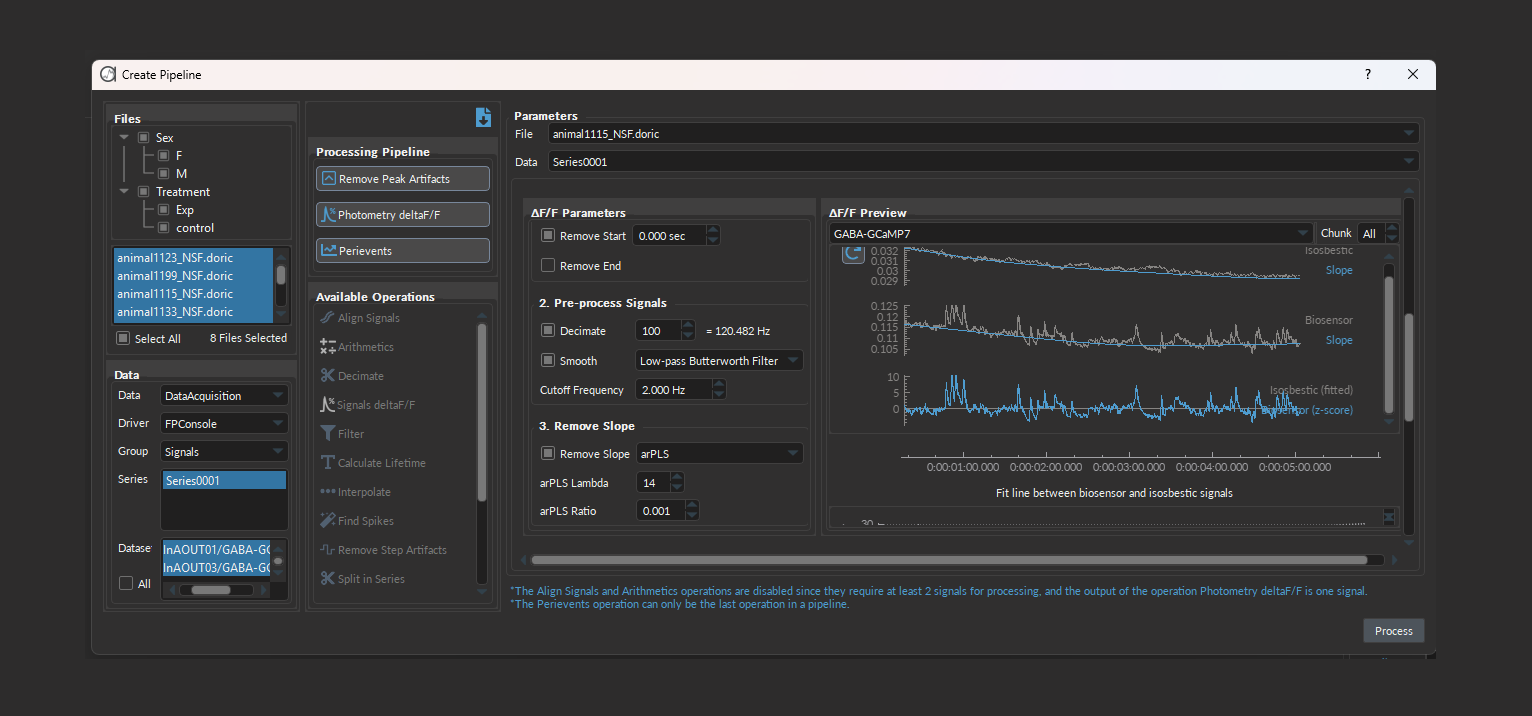
Chain multiple operations together and run them over ALL of your animal data files.
Test parameters on each animal and preview the output data.

Fiber Photometry Operations
Over a dozen fiber photometry operations are available and can be selected for batch processing, including remove artifcats, remove baseline, filter, interpolation, resampling, smooth signals, several different ways to calculate ∆F/F, find spikes, standardization, and many more... Here are a few highlights and their tutorial videos:


This multi-steps operation includes removing the baseline, smoothing the signal, substracting the isosbestic trace to remove motion artifacts and optionnal standardization.
Detects peaks in your fiber photometry signal. New feature (not in video): multiple iterations find smaller spikes and smooth the data to reduce false positives.

Remove Artifacts
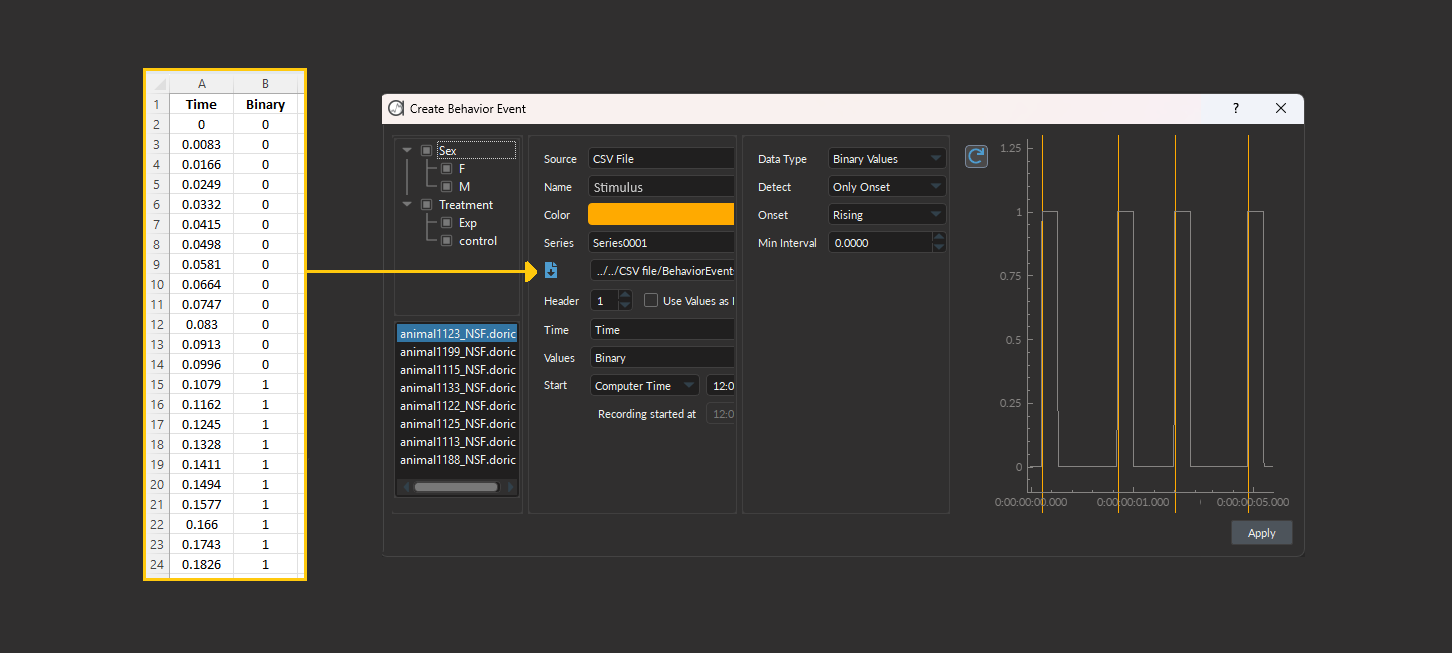
This operation outputs timestamps of behavior or stimuli that occured during the fiber photometry recording, and are called Events in danse. These timestamps can be only the rising (onset), falling (offset) or duration (onset & offset).
Behavior events can be created from imported .csv data, manually-entered timepoints, from recorded digital (TTL) or analog signals, or from measures created in danse™ (speed, motion score presence in zone, distance from point, etc.).
Behavior events are important for operation combining neural and behavior data together. and are required inputs for PeriEvent and Signal Statistics plots.
- Overlay on Fiber Photometry data
- Input to Analysis Operations

Remove baseline

Animal Tracking Operation
Danse™ provides several operations to calculate animal coordinates, including Animal Tracking and Pose Estimation operations. The Animal tracking uses a simple thresholding approach to detect the animal from the background, requiring on high contrast between the two (e.g. dark animal on light background, or vice versa).
This algorithm will then calculate the center point within the animal for each frame. For more complex coordinates (like nose, tail, etc.) see Pose Estimation operation instead.
Many of the behavior operations (calculate speed, prescence in zone, or distance from point) required animal coordinates as the imput.
- Prerequisite: Behavior video
- Input to Behavior & Analysis Operations

Pose Estimation
Danse™ provides several operations to calculate animal coordinates, including Animal Tracking and Pose Estimation operations.
The Pose Estimation operation labels more complex animal coordinates beyond the center body point (from Animal Tracking operation), such as nose, tail, paws, etc. And is much more robust to varying cage illumination and shadows. However, this operation is in fact DeepLabCut integration and requires a good GPU and specific libraries GPU intallations.
danse™ integration of the open source library is intended to remove difficulties installing, training and facilitate running and optimizing the algorithm.
- Prerequisite: Behavior video
- Input to Behavior & Analysis Operations

Calculate Speed
Speed is a useful behavioral metric because fiber photometry can capture rapid neural changes that align with moment-to-moment changes in movement, such as acceleration, deceleration, or freezing.
- Prerequisite: Animal Coordinates
- Input to Create Event Operation

Presence in Zone
Define a zone of interest and use animal coordinate to calculate when the animal is inside the zone.
- Prerequisite: Animal Coordinates
- Input to Create Event Operation
Behavior Operations
Danse™ provides a large number of behavior operations for both Doric and non-doric behavior videos and digital/analog signals.
Whether importing videos or using Doric Behavior Camera or CamLoop, Danse™ can directly process animal behavior within the software. Many of the behavior operations (calculate speed, prescence in zone, or distance from point) required animal coordinates as the imput.
Create Events
This operation outputs timestamps of behavior or stimuli that occured during the fiber photometry recording, and are called Events in danse. These timestamps can be only the rising (onset), falling (offset) or duration (onset & offset).
Behavior events can be created from imported .csv data, manually-entered timepoints, from recorded digital (TTL) or analog signals, or from measures created in danse™ (speed, motion score presence in zone, distance from point, etc.).
Behavior events are important for operation combining neural and behavior data together. and are required inputs for PeriEvent and Signal Statistics plots.
- Overlay on Fiber Photometry data
- Input to Analysis Operations
Create Time Periods
Devide your fiber photometry into distinct Time Periods.
Manual Time Periods:
Define windows of varying lengths where the animal encoutered or experianceed different conctexts (Baseline vs manipulation, new cage, drug injection, etc.).
Auto-Time Periods:
Divide the entire recording into even time windows (seconds, minutes, hours).
- Overlay on Fiber Photometry data
- Input to Analysis Operations
Animal Tracking Operation
Danse™ provides several operations to calculate animal coordinates, including Animal Tracking and Pose Estimation operations. The Animal tracking uses a simple thresholding approach to detect the animal from the background, requiring on high contrast between the two (e.g. dark animal on light background, or vice versa).
This algorithm will then calculate the center point within the animal for each frame. For more complex coordinates (like nose, tail, etc.) see Pose Estimation operation instead.
Many of the behavior operations (calculate speed, prescence in zone, or distance from point) required animal coordinates as the imput.
- Prerequisite: Behavior video
- Input to Behavior & Analysis Operations
Pose Estimation
Danse™ provides several operations to calculate animal coordinates, including Animal Tracking and Pose Estimation operations.
The Pose Estimation operation labels more complex animal coordinates beyond the center body point (from Animal Tracking operation), such as nose, tail, paws, etc. And is much more robust to varying cage illumination and shadows. However, this operation is in fact DeepLabCut integration and requires a good GPU and specific libraries GPU intallations.
danse™ integration of the open source library is intended to remove difficulties installing, training and facilitate running and optimizing the algorithm.
- Prerequisite: Behavior video
- Input to Behavior & Analysis Operations
Calculate Speed
Speed is a useful behavioral metric because fiber photometry can capture rapid neural changes that align with moment-to-moment changes in movement, such as acceleration, deceleration, or freezing.
- Prerequisite: Animal Coordinates
- Input to Create Event Operation
Presence in Zone
Define a zone of interest and use animal coordinate to calculate when the animal is inside the zone.
- Prerequisite: Animal Coordinates
- Input to Create Event Operation
Import Behavior Data
If your behavior data was not recorded in Doric Neuroscience Studio, use the following operations to import behavior data into your existing .doric file/experiment project. These operations are compatible for common behavior recording systems: Noldus, ANY-Maze, MedAssociate, DeepLabCut, etc. and in different formats (video or csv file). Several sychronization methods are available to insure the behavior and neural data are well aligned to each other. Contact Doric support to learn more.
NOTE: For those recording behavior with Doric Neuroscience Studio, can directly process behavior in danse™.


Analysis Operation
Analysis operations are the core strength of the danse™ software, providing simple way to combine behavior and neural data together. Specifically, these operations offer different ways of quantifying how neural activity changes around key behavior time points.

Perievent Operation
Perievent Histograms (also called peri-stimulus time histograms or PSTHs) visualizes changes in neural activity in response to the onset (or offset) of a stimulus or behavior of interst (i.e event). This plot is calculated by aligning and averaging the ΔF/F0 centered arount that, resulting in the average neural response over time.
Statistics associated to the PeriEvents trace are also calculated, including Aera-under-the-curve (AUC), maximum, minimum, etc.

Signal Statistics Operation
The Signal Statistic operation examines changes in neural activity over the duration of the entire duration of an event/time preiod (i.e not just the onset/offset of the event). This operation is ideal for behaviors of varying lengths (freezing, entering zone, animal interactions, etc.).
Calculate the following statistics:
- z-ΔF/F0 : AUC, mean, median, max, min
- Spikes : amplitude, firing rate, # spikesul behavioral metric because fiber photometry can capture rapid neural changes that align with moment-to-moment changes in movement, such as acceleration, deceleration, or freezing.
- Behaviour Prerequisite: Time Periods or Events
- Photometry Prerequisite: dFF0 or spikes

Spatial Signal Operation
The spatial signal operation combines neural activity and animal tracking datainto a heatmap.The x and y axes of the heatmap corespond to the cage dimensions and the color is associated with the average ΔF/F0 signal when the animal was in this location.
Spatial Signal operation is ideal for analysis such as condition-place preference, Plus-maze, novel object, animal interactions and hippocampal place cells, among many others.
Heatmap Visualization
Plot perievent as a heatmap, such tha fort:
- Single animal perievents, each row corresponds to an event (trial/bout), while
- Group analysis perievents, each row corresponds to the average trace of one animal.
Export Operations
Save Figures
Save plots as .pdf, .png, .jpeg
Export Data as .csv
Use this text to share information about your brand with your customers. Describe a product, share announcements, or welcome customers to your store.

